In 2023, a significant portion of the U.S. population faced challenges in accessing sufficient food. Understanding the scope of food insecurity is crucial for addressing this issue effectively. The U.S. Department of Agriculture (USDA) provides detailed reports on household food security, offering insights into the prevalence and characteristics of food insecurity across the nation.
Food security is defined as having consistent access to enough food for an active, healthy life for all household members. Conversely, food insecurity indicates limited or uncertain access to adequate food due to financial constraints or lack of resources. Here’s a breakdown of the latest statistics:
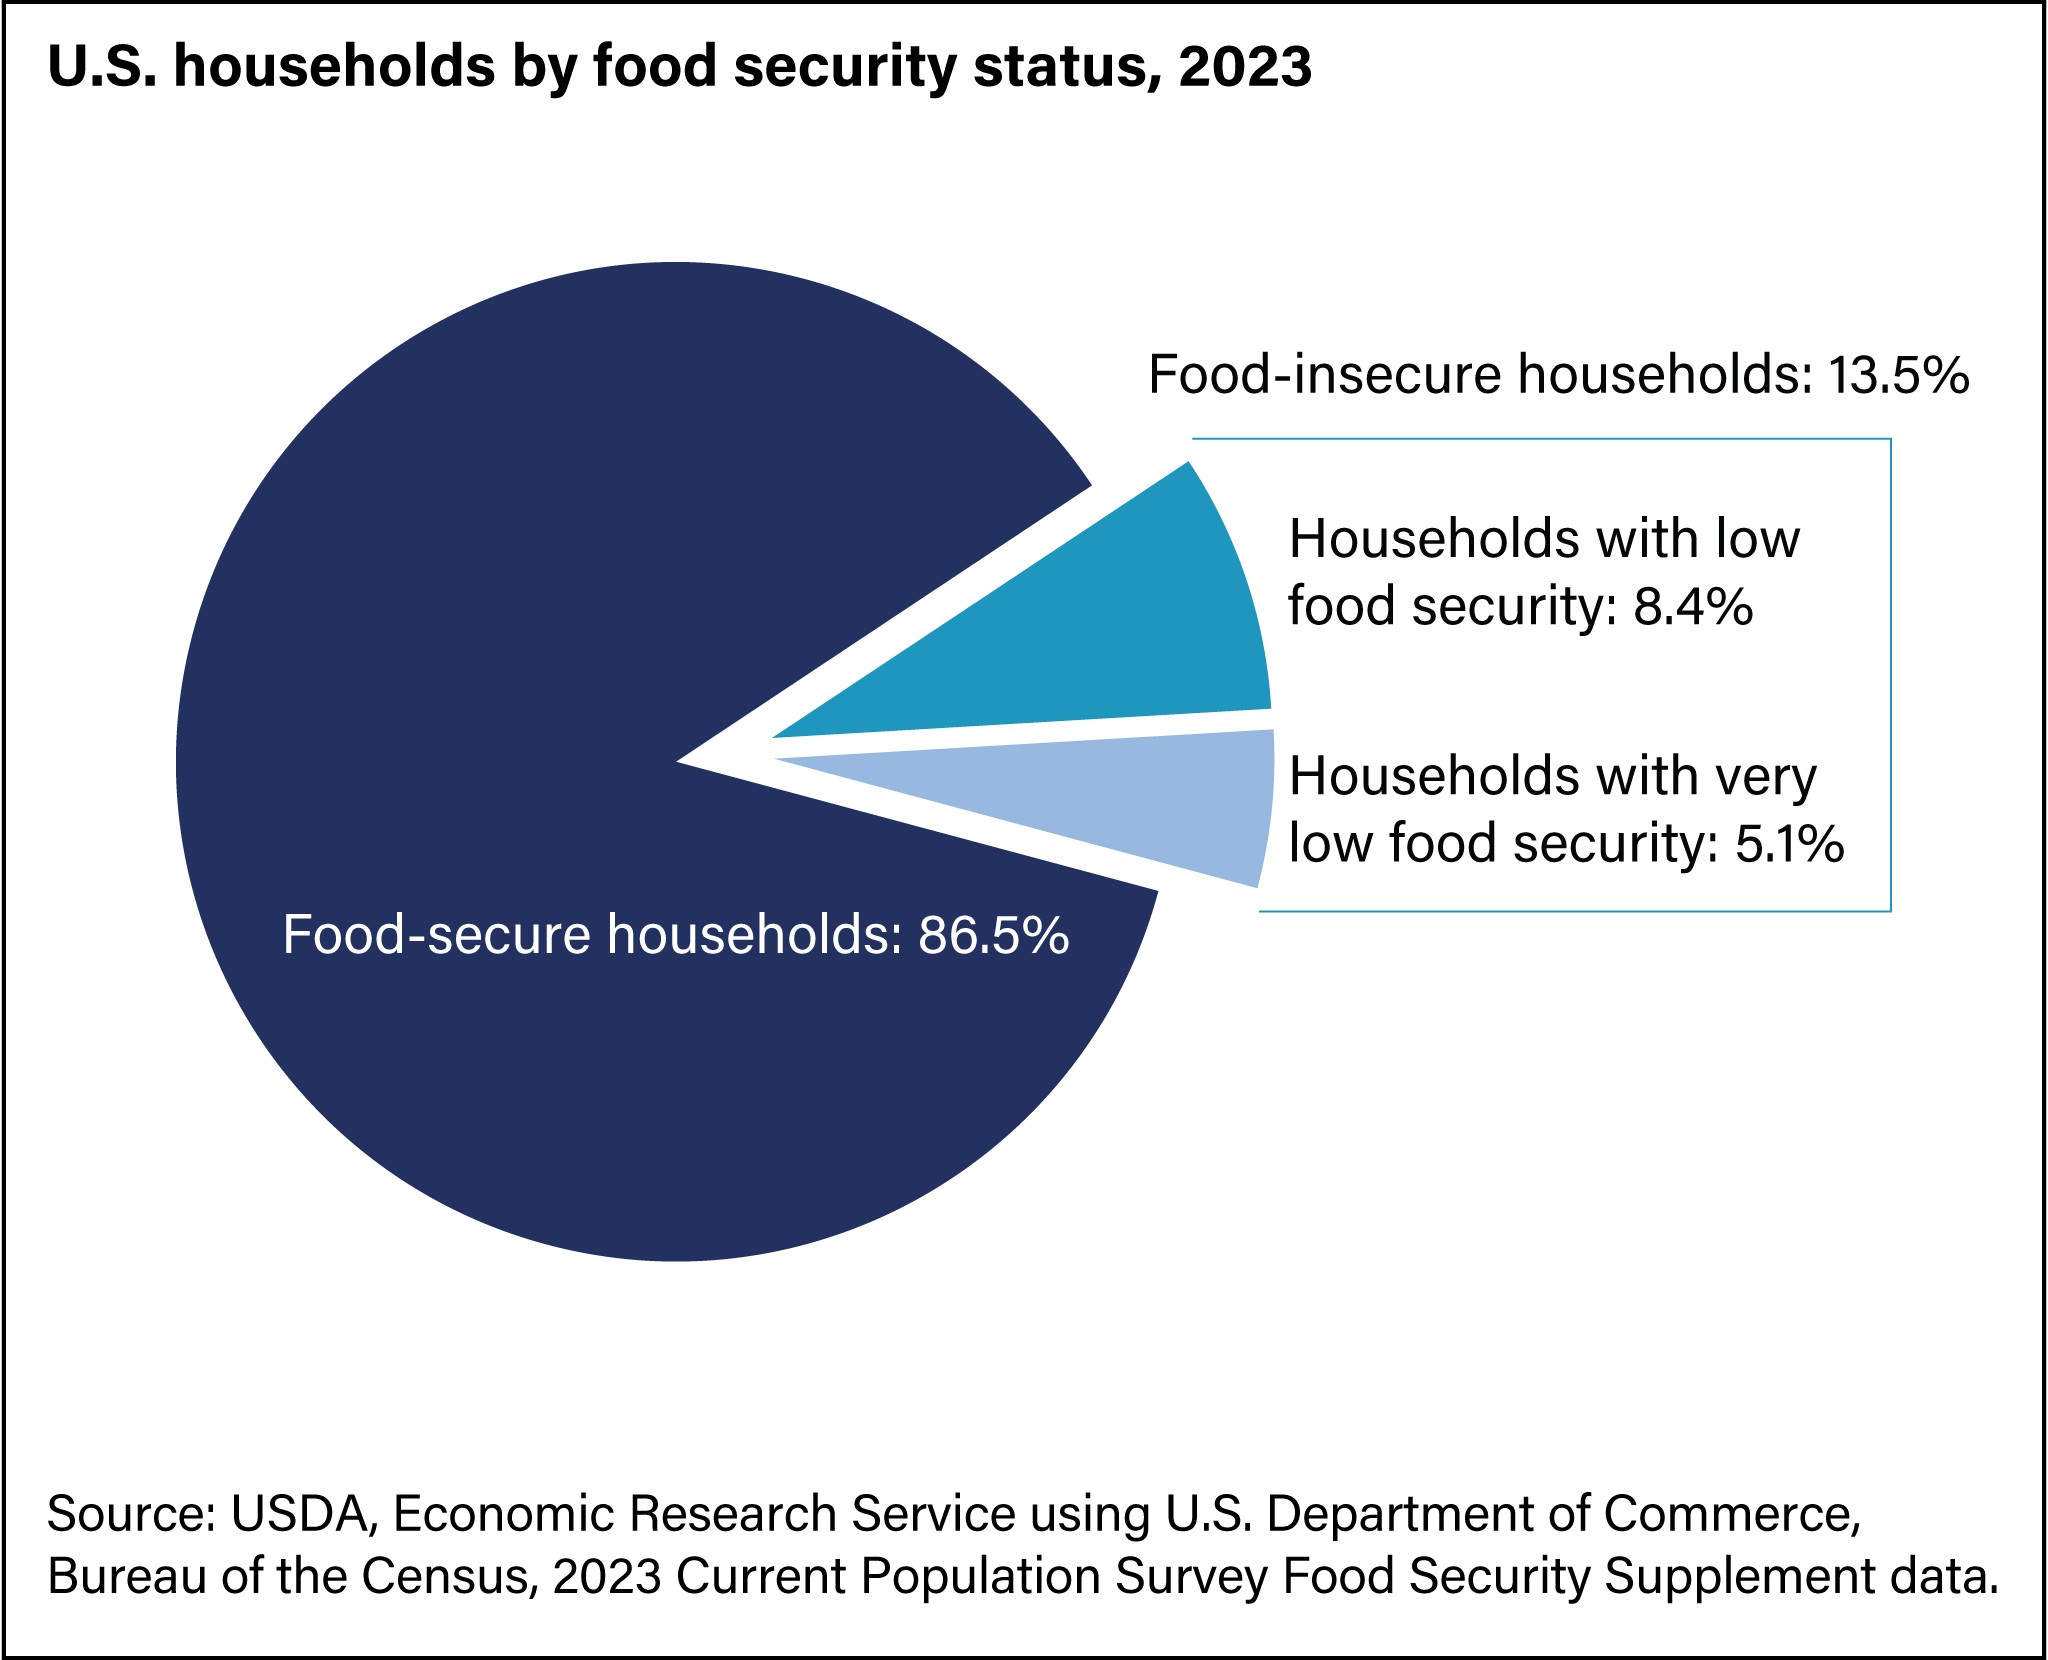
Key Statistics on Food Insecurity in the U.S. (2023)
In 2023, 86.5 percent (114.6 million) of U.S. households were food secure, indicating they had consistent access to adequate food. However, this also means that a considerable number of households struggled with food insecurity.
- Food Insecure Households: 13.5 percent (18.0 million) of U.S. households experienced food insecurity at some point during the year. This represents a statistically significant increase from 12.8 percent (17.0 million) in 2022.
- Individuals Affected: 47.4 million people lived in food-insecure households.
- Low Food Security: 8.4 percent (11.2 million) of households had low food security, managing to avoid substantial disruptions in eating patterns through various coping strategies. This is also a statistically significant increase from 7.7 percent (10.2 million) in 2022.
- Very Low Food Security: 5.1 percent (6.8 million) of households experienced very low food security, where normal eating patterns were disrupted, and food intake was reduced. This rate remained unchanged from 2022.
These numbers underscore the fact that millions of Americans are facing challenges in meeting their basic food needs. The reasons behind food insecurity are complex and multifaceted, often tied to income, employment, and access to resources.
Food Insecurity Among Households with Children
Food insecurity also affects households with children, presenting unique challenges. In 2023, the statistics reveal the following:
- Food Secure Households with Children: 82.1 percent (29.7 million) of households with children were food secure.
- Food Insecure Households with Children: 17.9 percent (6.5 million) of households with children experienced food insecurity.
- Adults Only Food Insecurity: In 9.0 percent (3.3 million) of households with children, only adults were food insecure.
- Children and Adults Food Insecurity: Both children and adults were food insecure in 8.9 percent of households (3.2 million households).
- Children Experiencing Reduced Food Intake: Approximately 1.0 percent of households with children (374,000 households) saw one or more child experiencing reduced food intake and disrupted eating patterns.
- Children in Food-Insecure Households: 7.2 million children lived in food-insecure households where children, along with adults, were food insecure.
- Children with Very Low Food Security: 841,000 children (1.2 percent of the Nation’s children) lived in households in which one or more child experienced very low food security.
Understanding how food insecurity affects children is crucial, as it can have long-term impacts on their health, development, and overall well-being.
Trends in Food Insecurity Prevalence Rates
Analyzing trends in food insecurity rates over time provides valuable context for understanding the current situation.
- Recent Increases: The 2023 prevalence of food insecurity (13.5 percent) was statistically significantly higher than the 2022 prevalence of 12.8 percent. It was also significantly higher than the prevalence observed from 2015 through 2022.
- Historical Comparisons: While the 2023 rate is higher than recent years, it remains statistically lower than the levels observed from 2010 through 2014.
- Fluctuations Over Time: Food insecurity rates have fluctuated over the years, influenced by economic conditions and various socio-economic factors. For instance, a decline was noted from 11.1 percent in 2018 to 10.5 percent in 2019 and remained steady in 2020.
Food Insecurity by Household Characteristics
The prevalence of food insecurity varies across different household demographics. Understanding these disparities is essential for targeted interventions.
In 2023, there were statistically significant increases in food insecurity compared to 2022 for several populations, including households without children.
State-Level Prevalence of Food Insecurity
Food insecurity rates also differ significantly from state to state. Data from 2021-2023 combined provide a more reliable view at the state level:
- Highest Rates: Arkansas had the highest estimated prevalence of food insecurity at 18.9 percent.
- Lowest Rates: New Hampshire had the lowest estimated prevalence of food insecurity at 7.4 percent.
Addressing Food Insecurity: A Call to Action
Understanding “How Many People Are Food Insecure In The United States” is just the first step. Addressing this complex issue requires a multi-faceted approach involving government programs, community initiatives, and individual efforts. By staying informed and supporting policies and programs that combat food insecurity, we can work towards ensuring that all Americans have access to enough food for a healthy and productive life.