Understanding how many people in US rely on food stamps is crucial for assessing the nation’s nutritional safety net. FOODS.EDU.VN delves into the Supplemental Nutrition Assistance Program (SNAP), exploring participation rates, eligibility criteria, and its impact on American households. Discover insights into food assistance programs, food security, and low-income nutrition through our detailed analysis.
1. SNAP Participation: A Deep Dive into Food Stamp Usage
The Supplemental Nutrition Assistance Program (SNAP), commonly referred to as food stamps, serves as a crucial lifeline for millions of Americans facing food insecurity. Examining the number of individuals and households participating in SNAP provides valuable insights into the program’s reach and effectiveness.
In April 2023, SNAP provided assistance to 41.9 million individuals across 22.2 million households. This figure represents approximately 12.5% of the total U.S. population, highlighting the significant role SNAP plays in supporting vulnerable populations.
1.1. Historical Trends in Food Stamp Enrollment
Analyzing historical trends in SNAP enrollment reveals fluctuations influenced by economic conditions, policy changes, and demographic shifts.
| Year | Average Monthly Recipients (Millions) | Households (Millions) |
|---|---|---|
| 1974 | 12.9 | N/A |
| 2013 | 47.6 | 23.1 |
| 2020 (March) | 37.2 | N/A |
| 2020 (September) | 43.0 | N/A |
| 2022 (Fiscal Year) | 41.2 | 21.6 |
| 2023 (April) | 41.9 | 22.2 |
During the Great Recession, SNAP participation surged, reaching a peak of 47.6 million individuals in 2013. The COVID-19 pandemic also led to a notable increase in enrollment, with numbers climbing from 37.2 million in March 2020 to over 43 million by September 2020. These fluctuations underscore SNAP’s responsiveness to economic crises and its vital role in mitigating food insecurity during challenging times. You can find more data on this at FOODS.EDU.VN.
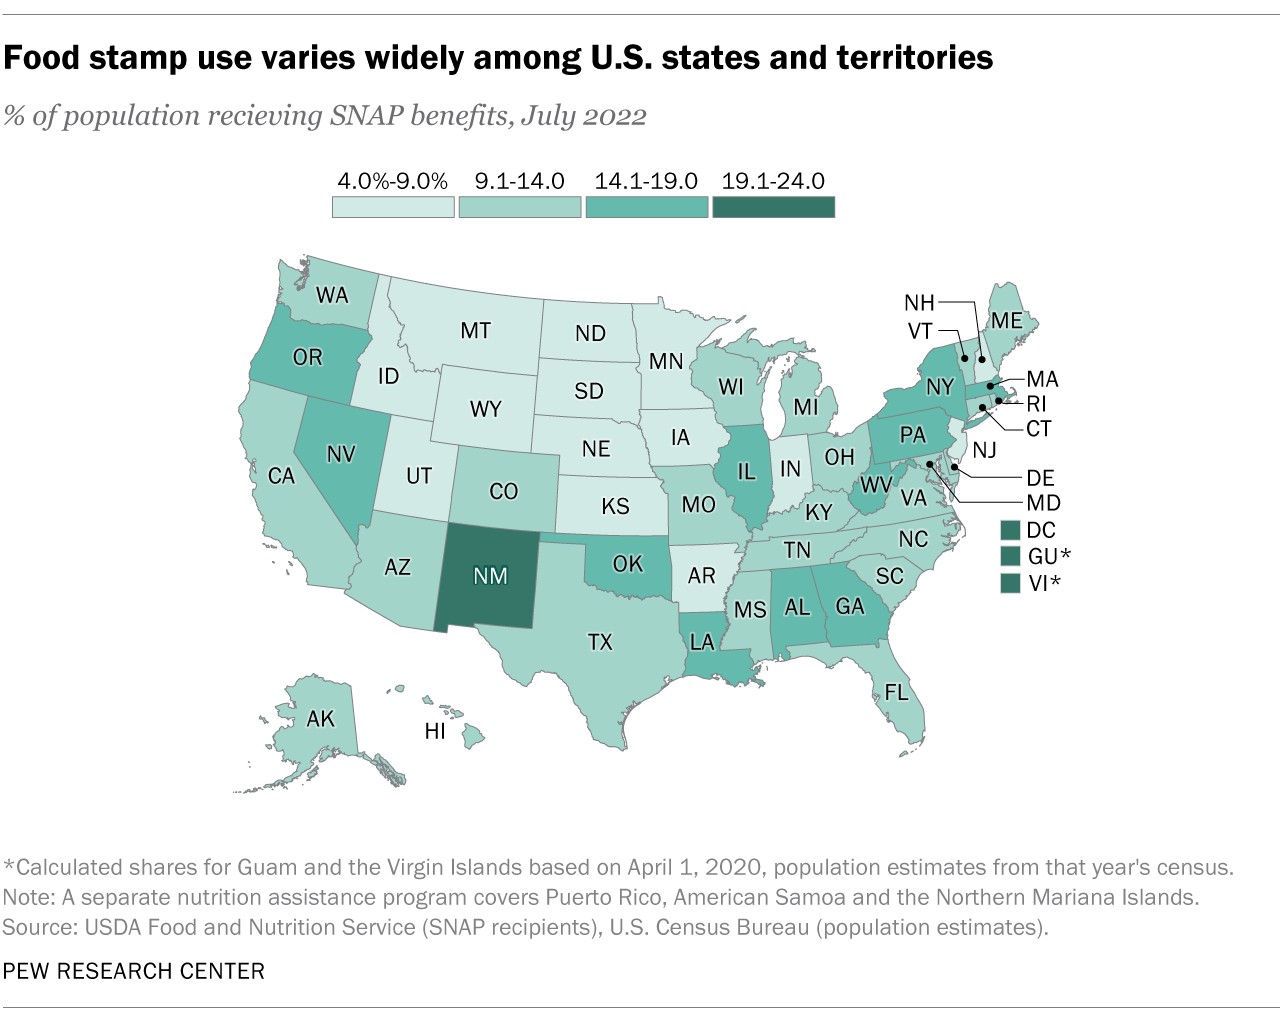
1.2. State-by-State Variation in SNAP Usage
SNAP usage rates vary significantly across states, reflecting differences in poverty levels, economic conditions, and program administration.
| State | SNAP Participation Rate (July 2022) |
|---|---|
| New Mexico | 22.9% |
| District of Columbia | 21.4% |
| Oregon | 17.8% |
| West Virginia | 17.7% |
| Utah | 4.6% |
| New Hampshire | 5.0% |
| Wyoming | 5.1% |
| North Dakota | 5.8% |
New Mexico has the highest SNAP participation rate at 22.9%, while Utah has the lowest at 4.6%. These disparities highlight the importance of tailored approaches to addressing food insecurity at the state level.
2. Eligibility for Food Stamps: Understanding the Criteria
To understand how many people in US use food stamps, it’s important to consider the requirements for enrollment. SNAP eligibility is determined by a combination of income, household size, and asset limits.
2.1. Income Requirements
Generally, a household is eligible for SNAP if its gross monthly income is at or below 130% of the federal poverty level and its net monthly income is at or below 100% of the federal poverty level. For a family of four in 2023, this translates to a gross monthly income of $3,007 and a net monthly income of $2,313. However, these income limits may vary in Alaska and Hawaii.
Households with elderly individuals (60+) or people with disabilities are only required to meet the net income requirement, providing additional support to these vulnerable groups.
2.2. Asset Limits
In addition to income restrictions, households must also adhere to asset limits to qualify for SNAP. These limits restrict the amount of cash, investments, and other assets a household can possess while remaining eligible for benefits. These limits help ensure that SNAP resources are directed towards those with the greatest need.
2.3. Categorical Eligibility
Households receiving other forms of assistance, such as Temporary Assistance for Needy Families (TANF) or Supplemental Security Income (SSI), may be automatically eligible for SNAP. This provision streamlines the enrollment process and ensures coordinated support for families facing multiple challenges.
2.4. State Flexibility
States have some flexibility in administering the SNAP program. For instance, they can decide how broadly to extend benefits to individuals receiving TANF-funded benefits, whether to count vehicles as household assets, and whether to consider child support payments as income. These variations allow states to tailor SNAP to meet the unique needs of their populations.
3. Work Requirements for SNAP Recipients: Balancing Support and Responsibility
Work requirements are a key component of SNAP, aimed at promoting self-sufficiency among recipients.
3.1. General Work Requirements
Most Americans aged 16 to 59 who are not disabled are required to register with their state SNAP agency or employment office, meet any work, job search, or job training requirements set by their state, accept suitable job offers, and work at least 30 hours per week. Non-compliance with these rules can result in disqualification from SNAP benefits.
3.2. ABAWD Requirements
Able-bodied adults without dependents (ABAWDs) face additional work requirements. They must work or participate in a work program for 80 hours per month or participate in a state workfare program. Failure to meet these requirements limits SNAP benefits to three months out of any 36-month period. The recent debt limit deal raises the maximum age for these requirements to 54, phased in over three years starting in October.
3.3. Exemptions
Certain populations are exempt from SNAP work requirements, including veterans, homeless individuals, and young adults aging out of foster care. These exemptions recognize the unique challenges faced by these groups and ensure they receive the support they need.
4. Demographics of SNAP Recipients: Who Benefits from Food Stamps?
Analyzing the demographic characteristics of SNAP recipients provides insights into the program’s reach across different populations. The Census Bureau’s Survey of Income and Program Participation (SIPP) offers comprehensive data on SNAP recipients.
4.1. Age Distribution
In 2020, 63% of SNAP recipients were adults, while 36% were children. This breakdown highlights the importance of SNAP in supporting both adults and children facing food insecurity.
4.2. Racial and Ethnic Composition
| Race/Ethnicity | Adult Recipients (%) | Child Recipients (%) |
|---|---|---|
| Non-Hispanic White | 44.6 | 31.5 |
| Black | 27.0 | 27.0 |
| Hispanic (Any Race) | 21.9 | 35.8 |
Non-Hispanic White individuals make up the largest share of adult SNAP recipients (44.6%), while Hispanic individuals account for the largest percentage of child recipients (35.8%). Black individuals represent a significant proportion of both adult and child recipients (27%).
4.3. Nativity
The vast majority of both adult and child SNAP recipients were born in the United States, with 82.3% of adult recipients and 97.1% of child recipients being native-born.
4.4. Education and Employment
Among adult SNAP recipients, 62.4% had a high school diploma or less education in 2020. Despite work requirements, 61.6% reported not being employed at all that year, underscoring the challenges faced by SNAP recipients in finding stable employment.
4.5. Household Composition
Over six in ten SNAP-receiving households (61.7%) reported having no children in 2020, including 34.4% who were individuals living alone. More than 40% of SNAP-receiving households were located in the South, the highest percentage of any region.
5. SNAP Benefit Amounts: How Much Do Recipients Receive?
The amount of SNAP benefits recipients receive varies based on factors such as income, household size, and state of residence.
5.1. National Averages
In April 2023, the national average SNAP benefit was $181.72 per person and $343.00 per household. These amounts represent a significant decrease from February averages due to the expiration of pandemic-era benefit enhancements.
5.2. State-by-State Variation
SNAP benefits vary considerably by state. For example, in April 2023, recipients in New York received an average of $212.09 per person, while those in Oklahoma received $127.32. These differences reflect variations in living costs, economic conditions, and state-specific policies.
5.3. Factors Influencing Benefit Levels
Benefit amounts are primarily determined by recipients’ income, minus certain expenses. Household size also plays a role in the calculation. States with higher living costs or larger household sizes may see higher average benefit levels.
5.4. Thrifty Food Plan
The maximum amount of SNAP benefits is based on the Thrifty Food Plan, an estimate by the USDA of the cost to buy groceries for a nutritious, cost-effective diet for a family of two adults and two children. This plan is adjusted for other household types when determining benefit levels and is re-evaluated periodically to reflect changing food costs.
6. What Can You Buy with Food Stamps? SNAP Eligible Items
SNAP benefits can be used to purchase a wide range of food items for household consumption.
6.1. Eligible Food Items
SNAP benefits can be used to buy most groceries, including:
- Breads and pastries
- Meats, poultry, and fish
- Fruits and vegetables
- Dairy products
- Snack foods (cookies, cakes, soft drinks)
- Plants and seeds to grow food
6.2. Ineligible Items
Certain items cannot be purchased with SNAP benefits, including:
- Alcoholic beverages
- Tobacco products
- Nutritional supplements
- Medicines
- Pet food
- Hot foods (rotisserie chickens, ready-to-eat soups)
- Household goods (paper towels, cleaning products)
- Gasoline
6.3. Supporting Healthy Choices
While SNAP allows the purchase of some less nutritious items, the program aims to support healthy eating habits by providing access to essential food groups. Efforts are underway to encourage SNAP recipients to make healthier choices through nutrition education and incentives for purchasing fruits and vegetables. You can learn more about healthy eating on FOODS.EDU.VN.
7. Where Can You Use Food Stamps? SNAP Retailer Locations
SNAP benefits can be used at a variety of retail establishments that have been authorized by the USDA.
7.1. Types of Retailers
In fiscal year 2021, over 254,000 establishments accepted SNAP benefits. These include:
- Supermarkets and superstores (Walmart, Target)
- Grocery stores
- Convenience stores
- Farmers markets
- Internet retailers (Amazon)
7.2. Redemption Patterns
Supermarkets and superstores account for approximately 15% of SNAP-accepting establishments but handle nearly 80% of all redemptions. Convenience stores make up over 44% of SNAP-accepting establishments but account for only about 5% of redemptions. Internet retailers represent a small fraction of authorized retailers but handle a growing share of redemptions.
7.3. Expanding Access
Efforts are ongoing to expand access to SNAP benefits through initiatives such as mobile SNAP processing at farmers markets and partnerships with online retailers to facilitate online grocery purchases for SNAP recipients.
8. Federal Spending on Food Stamps: A Fiscal Overview
SNAP represents a significant investment in the nation’s nutritional safety net.
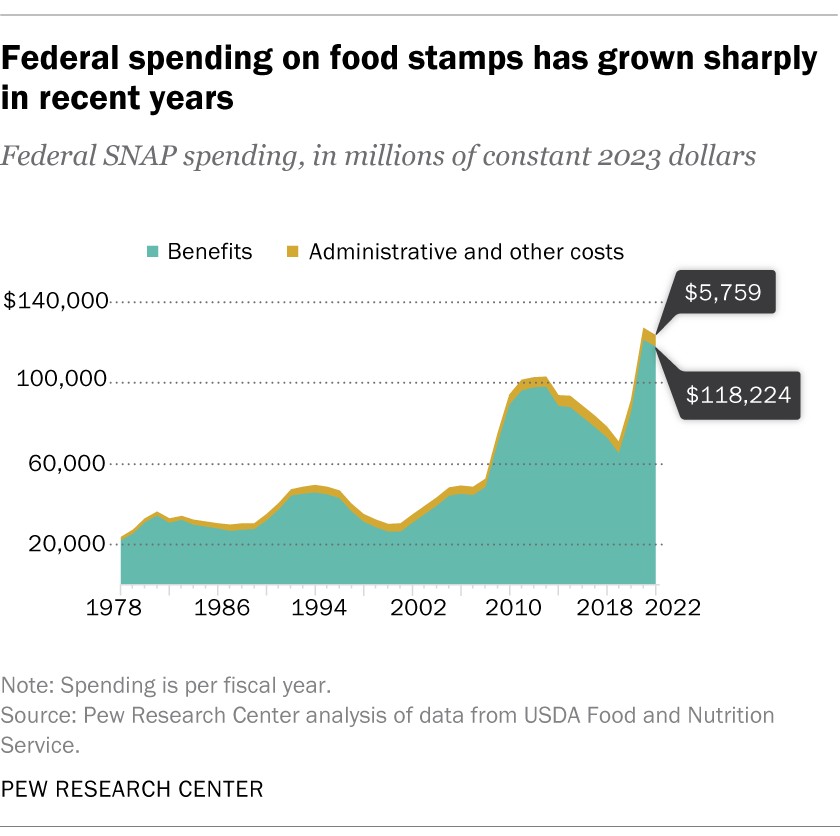
8.1. Annual Expenditures
In fiscal year 2022, the federal government spent $119.4 billion on SNAP, with $113.9 billion allocated to benefits and $5.5 billion to administrative and other expenses. Through the first seven months of fiscal 2023, spending on benefits totaled nearly $70 billion, a 2.8% increase compared to the same period in fiscal 2022.
8.2. Comparison to Other Programs
SNAP is one of the largest federal social welfare programs in terms of cost. In fiscal 2022, the federal government spent:
- $747.2 billion on Medicare
- $591.9 billion on Medicaid
- $161.2 billion on veterans’ benefits
- $58.8 billion on Supplemental Security Income
- $33.1 billion on unemployment compensation
8.3. Historical Trends in Spending
Adjusted for inflation, annual spending on SNAP followed a regular pattern from the late 1970s to 2008, decreasing during strong economic times and increasing during and after recessions. The Great Recession disrupted this pattern, with spending on SNAP continuing to rise even as the economy recovered. The COVID-19 pandemic led to a surge in SNAP spending, reaching $127.6 billion in fiscal 2021.
9. The History of Food Stamps: From Stamps to Debit Cards
The modern SNAP program has evolved significantly from its origins in the 1930s.
9.1. Early Food Stamp Program (1939-1943)
The precursor to SNAP, which began in 1939, used actual stamps to help both the hungry and farmers struggling with surplus crops. Recipients could purchase orange stamps exchangeable for most food items and received blue stamps for USDA-designated surplus commodities.
9.2. Revival in the 1960s
The program was revived in 1964 as part of President Lyndon Johnson’s “War on Poverty” and was formally named the Food Stamp Program. Instead of stamps, beneficiaries purchased multicolored “food coupons.”
9.3. Modernization and Renaming
The purchase requirement was eliminated in 1977, benefits began to be widely delivered by debit card in the 1990s, and by 2004, the paper coupons were phased out. The program was renamed SNAP in 2008.
10. Frequently Asked Questions (FAQs) About Food Stamps
Here are some common questions about the Supplemental Nutrition Assistance Program:
- Who is eligible for SNAP benefits? Eligibility is based on income, household size, and asset limits.
- How much SNAP benefits can I receive? Benefit amounts vary depending on income, household size, and state of residence.
- What can I buy with SNAP benefits? SNAP benefits can be used to purchase most groceries, but not alcohol, tobacco, or hot foods.
- Where can I use SNAP benefits? SNAP benefits are accepted at authorized retailers, including supermarkets, grocery stores, and farmers markets.
- Are there work requirements for SNAP recipients? Most able-bodied adults are required to work or participate in a work program.
- How do I apply for SNAP benefits? You can apply for SNAP benefits through your state’s SNAP agency.
- Can undocumented immigrants receive SNAP benefits? Generally, no. SNAP is primarily available to U.S. citizens and certain legal immigrants.
- How is SNAP funded? SNAP is funded by the federal government.
- What is the impact of SNAP on food insecurity? SNAP is shown to significantly reduce food insecurity among recipients.
- How has SNAP changed over time? SNAP has evolved from a stamp-based program to a modern electronic benefit transfer (EBT) system.
By exploring these FAQs, one can better understand the intricacies of SNAP and its profound impact on American communities.
Understanding how many people in US rely on food stamps provides critical insights into the nation’s food security landscape. SNAP serves as a vital safety net, supporting millions of Americans in accessing nutritious food and improving their overall well-being. Through ongoing research, policy adjustments, and community engagement, we can continue to strengthen SNAP and ensure that all Americans have access to the food they need to thrive.
Ready to explore more culinary knowledge and discover a world of delicious possibilities? Visit FOODS.EDU.VN today for a wealth of recipes, cooking tips, and expert advice. Don’t miss out – your culinary journey starts here! For any inquiries, please contact us at 1946 Campus Dr, Hyde Park, NY 12538, United States, or via WhatsApp at +1 845-452-9600. Our team at foods.edu.vn is excited to help you elevate your cooking skills!